open flash chart rails x-axis issue
Posted
by Jimmy
on Stack Overflow
See other posts from Stack Overflow
or by Jimmy
Published on 2010-04-11T01:07:05Z
Indexed on
2010/04/11
1:13 UTC
Read the original article
Hit count: 736
ruby-on-rails
|open-flash-chart
Hey guys,
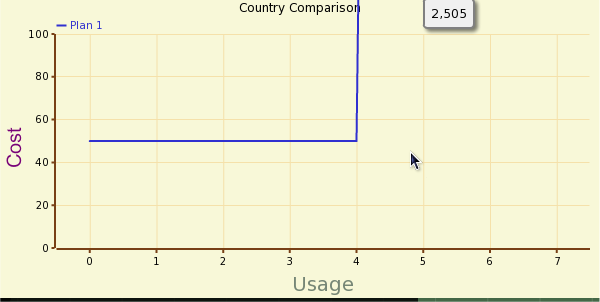
I am using open flash chart 2 in my rails application. Everything is looking smooth except for the range on my x axis. I am creating a line to represent cell phone plan cost over a specific amount of usage and I'm generate 8 values, 1-5 are below the allowed usage while 6-8 are demonstrations of the cost for usage over the limit.
The problem I'm encountering is how to set the range of the X axis in ruby on rails to something specific to the data. Right now the values being displayed are the indexes of the array that I'm giving. When I try to hand a hash to the values the chart doesn't even load at all.
So basically I need help getting a way to set the data for my line properly so that it displays correctly, right now it is treating every value as if it represents the x value of the index of the array.
Here is a screen shot which may be a better description than what I am saying: http://i163.photobucket.com/albums/t286/Xeno56/Screenshot.png Note that those values are correct just the range on the x-axis is incorrect, it should be something like 100, 200, 300, 400, 500, 600, 700
Code:
y = YAxis.new
y.set_range(0,100, 20)

x_legend = XLegend.new("Usage")
x_legend.set_style('{font-size: 20px; color: #778877}')

y_legend = YLegend.new("Cost")
y_legend.set_style('{font-size: 20px; color: #770077}')

chart =OpenFlashChart.new
chart.set_x_legend(x_legend)
chart.set_y_legend(y_legend)
chart.y_axis = y

line = Line.new
line.text = plan.name
line.width = 2
line.color = '#006633'
line.dot_size = 2
line.values = generate_data(plan)
chart.add_element(line)

def generate_data(plan)
  values = []
  #generate below threshold numbers
  5.times do |x|
    usage = plan.usage / 5 * x
    cost = plan.cost * 10
    values << cost
  end
  #generate above threshold numbers
  3.times do |x|
    usage = plan.usage + ((plan.usage / 5) * x)
    cost = plan.cost + (usage * plan.overage)
    values << cost
  end
  return values
end
© Stack Overflow or respective owner