Conditionally colour data points outside of confidence bands in R
Posted
by D W
on Stack Overflow
See other posts from Stack Overflow
or by D W
Published on 2010-04-21T23:21:17Z
Indexed on
2010/04/21
23:23 UTC
Read the original article
Hit count: 279
I need to colour datapoints that are outside of the the confidence bands on the plot below differently from those within the bands. Should I add a separate column to my dataset to record whether the data points are within the confidence bands? Can you provide an example please?
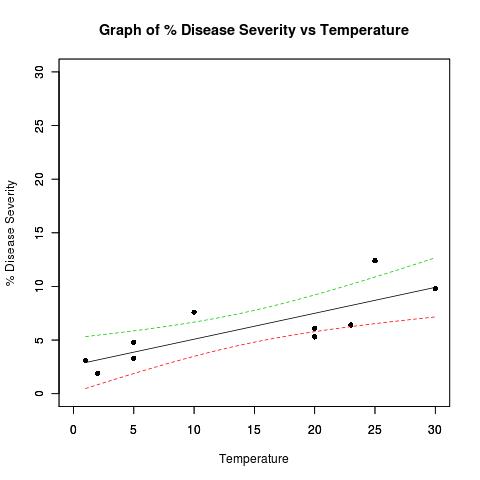
Example dataset:
## Dataset from http://www.apsnet.org/education/advancedplantpath/topics/RModules/doc1/04_Linear_regression.html

## Disease severity as a function of temperature

# Response variable, disease severity
diseasesev<-c(1.9,3.1,3.3,4.8,5.3,6.1,6.4,7.6,9.8,12.4)

# Predictor variable, (Centigrade)
temperature<-c(2,1,5,5,20,20,23,10,30,25)

## For convenience, the data may be formatted into a dataframe
severity <- as.data.frame(cbind(diseasesev,temperature))

## Fit a linear model for the data and summarize the output from function lm()
severity.lm <- lm(diseasesev~temperature,data=severity)

jpeg('~/Desktop/test1.jpg')

# Take a look at the data
plot(
  diseasesev~temperature,
  data=severity,
  xlab="Temperature",
  ylab="% Disease Severity",
  pch=16,
  pty="s",
  xlim=c(0,30),
  ylim=c(0,30)
)
title(main="Graph of % Disease Severity vs Temperature")
par(new=TRUE) # don't start a new plot

## Get datapoints predicted by best fit line and confidence bands
## at every 0.01 interval
xRange=data.frame(temperature=seq(min(temperature),max(temperature),0.01))
pred4plot <- predict(
                        lm(diseasesev~temperature),
                        xRange,
                        level=0.95,
                        interval="confidence"
                    )

## Plot lines derrived from best fit line and confidence band datapoints
matplot(
  xRange,
  pred4plot,
  lty=c(1,2,2),   #vector of line types and widths
  type="l",       #type of plot for each column of y
  xlim=c(0,30),
  ylim=c(0,30),
  xlab="",
  ylab=""
)
© Stack Overflow or respective owner