Label on the Chart using Microsoft Chart controls
Posted
by azamsharp
on Stack Overflow
See other posts from Stack Overflow
or by azamsharp
Published on 2010-04-21T18:01:15Z
Indexed on
2010/04/21
18:03 UTC
Read the original article
Hit count: 438
Filed under:
charts
I am creating a 3d chart using Microsoft Chart controls. Here is the image:
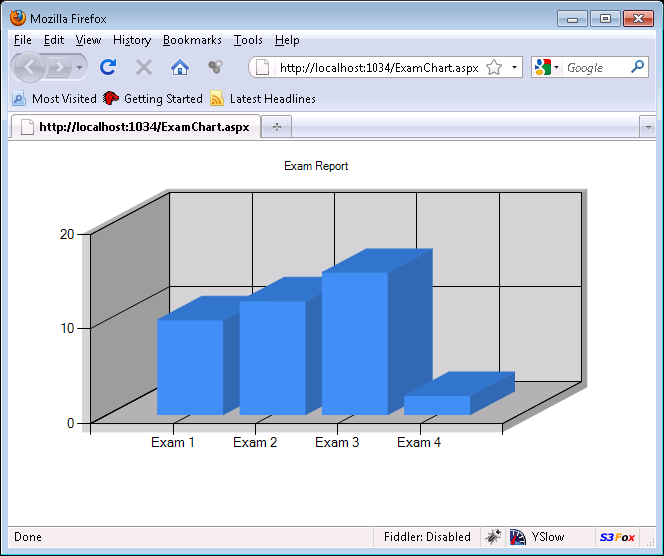
I want to show the point on the top of each bar graph. Like for Exam 1 on top of bar chart it should show 2 (as in 2 points) etc.
Here is the code:
private void BindData() {

            var exams = new List<Exam>()
            {
                new Exam() { Name = "Exam 1", Point = 10 },
                new Exam() { Name = "Exam 2", Point = 12 },
                new Exam() { Name = "Exam 3", Point = 15 },
                new Exam() { Name = "Exam 4", Point = 2 }
            };

            var series = ExamsChart.Series["ExamSeries"];


            series.YValueMembers = "Point";
            series.XValueMember = "Name";

            //series.MarkerStyle = System.Web.UI.DataVisualization.Charting.MarkerStyle.Circle;
            //series.MarkerSize = 20;
            //series.LegendText = "hellow";
            //series.Label = "something";


            var chartAreas = ExamsChart.ChartAreas["ChartArea1"];


            ExamsChart.DataSource = exams;
            ExamsChart.DataBind();
        }
and here is the html code:
<asp:Chart ID="ExamsChart" Width="600" Height="320" runat="server">
      <Titles>
      <asp:Title Text="Exam Report" />
      </Titles>
        <Series>
          <asp:Series Name="ExamSeries" ChartType="Column">
          </asp:Series>
        </Series>
        <ChartAreas>

          <asp:ChartArea Name="ChartArea1">
          <Area3DStyle Enable3D="true"  WallWidth="10" />
          </asp:ChartArea>
        </ChartAreas>
      </asp:Chart>
© Stack Overflow or respective owner