How can I structure and recode messy categorical data in R?
Posted
by briandk
on Stack Overflow
See other posts from Stack Overflow
or by briandk
Published on 2010-05-04T23:43:35Z
Indexed on
2010/05/04
23:48 UTC
Read the original article
Hit count: 413
r
|statistics
I'm struggling with how to best structure categorical data that's messy, and comes from a dataset I'll need to clean.
The Coding Scheme
I'm analyzing data from a university science course exam. We're looking at patterns in student responses, and we developed a coding scheme to represent the kinds of things students are doing in their answers. A subset of the coding scheme is shown below.
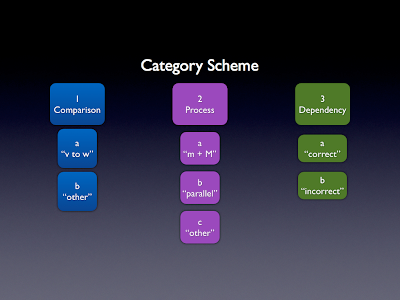
Note that within each major code (1, 2, 3) are nested non-unique sub-codes (a, b, ...).
What the Raw Data Looks Like
I've created an anonymized, raw subset of my actual data which you can view here.
Part of my problem is that those who coded the data noticed that some students displayed
multiple patterns. The coders' solution was to create enough columns (reason1, reason2,
...) to hold students with multiple patterns. That becomes important because the order
(reason1, reason2) is arbitrary--two students (like student 41 and student 42 in my
dataset) who correctly applied "dependency" should both register in an analysis, regardless of
whether 3a appears in the reason column or the reason2 column.
How Can I Best Structure Student Data?
Part of my problem is that in the raw data, not all students display the same patterns, or the same number of them, in the same order. Some students may do just one thing, others may do several. So, an abstracted representation of example students might look like this:
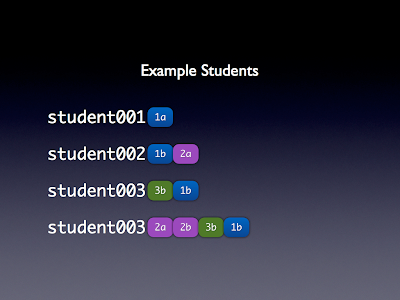
Note in the example above that student002 and student003 both are coded as "1b", although I've deliberately shown the order as different to reflect the reality of my data.
My (Practical) Questions
- Should I concatenate
reason1,reason2,...into one column? - How can I (re)code the
reasons in R to reflect the multiplicity for some students?
Thanks
I realize this question is as much about good data conceptualization as it is about specific features of R, but I thought it would be appropriate to ask it here. If you feel it's inappropriate for me to ask the question, please let me know in the comments, and stackoverflow will automatically flood my inbox with sadface emoticons. If I haven't been specific enough, please let me know and I'll do my best to be clearer.
© Stack Overflow or respective owner