Memory leak - debugger and memory analyzer disagreeing
Posted
by
Joe
on Stack Overflow
See other posts from Stack Overflow
or by Joe
Published on 2012-04-08T17:27:19Z
Indexed on
2012/04/08
17:29 UTC
Read the original article
Hit count: 488
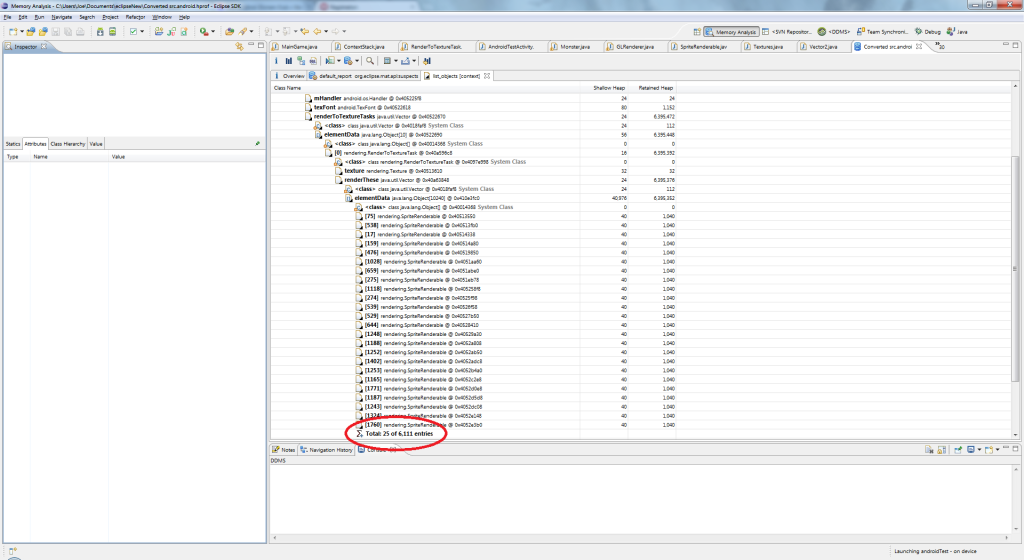
There is a memory leak in my android game - I've managed to narrow it down to a certain object, which has a list of objects to render on a texture. This object clears the list every time it draws though - so I can't work out how its managed to get thousands of elements in the list.
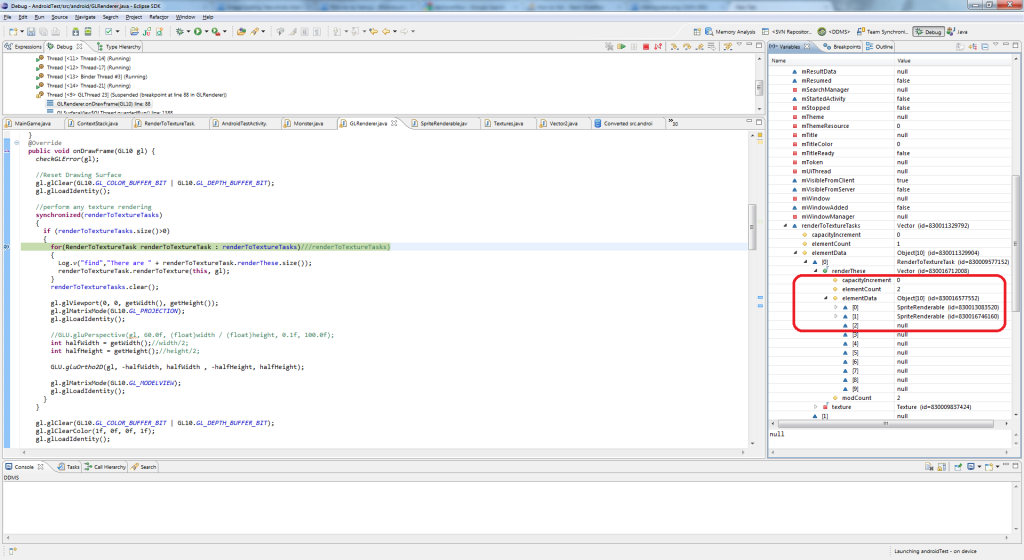
I checked in the debugger and it doesn't have all these thousands of elements - usually about 2-20 which is what I'd expect... The game definitely slows down progressively only if I have rendering to texturing on.
Here is a picture of Memory Analyzer showing 6,111 items:
Here is a picture of the debugger showing 2:
Can anyone help me find out whats wrong?
© Stack Overflow or respective owner