Different Not Automatically Implies Better
Posted
by Alois Kraus
on Geeks with Blogs
See other posts from Geeks with Blogs
or by Alois Kraus
Published on Tue, 05 Nov 2013 18:19:01 GMT
Indexed on
2013/11/06
3:55 UTC
Read the original article
Hit count: 421
Originally posted on: http://geekswithblogs.net/akraus1/archive/2013/11/05/154556.aspx
Recently I was digging deeper why some WCF hosted workflow application did consume quite a lot of memory although it did basically only load a xaml workflow. The first tool of choice is Process Explorer or even better Process Hacker (has more options and the best feature copy&paste does work). The three most important numbers of a process with regards to memory are Working Set, Private Working Set and Private Bytes.
- Working set is the currently consumed physical memory (parts can be shared between processes e.g. loaded dlls which are read only)
- Private Working Set is the physical memory needed by this process which is not shareable
- Private Bytes is the number of non shareable which is only visible in the current process (e.g. all new, malloc, VirtualAlloc calls do create private bytes)
When you have a bigger workflow it can consume under 64 bit easily 500MB for a 1-2 MB xaml file. This does not look very scalable. Under 64 bit the issue is excessive private bytes consumption and not the managed heap. The picture is quite different for 32 bit which looks a bit strange but it seems that the hosted VB compiler is a lot less memory hungry under 32 bit. I did try to repro the issue with a medium sized xaml file (400KB) which does contain 1000 variables and 1000 if which can be represented by C# code like this:
string Var1;
string Var2;
...
string Var1000;

if (!String.IsNullOrEmpty(Var1) )
{
     Console.WriteLine(“Var1”);
}
if (!String.IsNullOrEmpty(Var2) )
{
     Console.WriteLine(“Var2”);
}
....
Since WF is based on VB.NET expressions you are bound to the hosted VB.NET compiler which does result in (x64) 140 MB of private bytes which is ca. 140 KB for each if clause which is quite a lot if you think about the actually present functionality. But there is hope. .NET 4.5 does allow now C# expressions for WF which is a major step forward for all C# lovers. I did create some simple patcher to “cross compile” my xaml to C# expressions. Lets look at the result:
| C# Expressions | VB Expressions |
x86
 |
x86
 |
On my home machine I have only 32 bit which gives you quite exactly half of the memory consumption under 64 bit. C# expressions are 10 times more memory hungry than VB.NET expressions! I wanted to do more with less memory but instead it did consume a magnitude more memory. That is surprising to say the least. The workflow does initialize in about the same time under x64 and x86 where the VB code does it in 2s whereas the C# version needs 18s. Also nearly ten times slower. That is a too high price to pay for any bigger sized xaml workflow to convert from VB.NET to C# expressions. If I do reduce the number of expressions to 500 then it does need 400MB which is about half of the memory. It seems that the cost per if does rise linear with the number of total expressions in a xaml workflow.
| Expression Language | Cost per IF | Startup Time |
| C# 1000 Ifs x64 | 1,5 MB | 18s |
| C# 500 Ifs x64 | 750 KB | 9s |
| VB 1000 Ifs x64 | 140 KB | 2s |
| VB 500 Ifs x64 | 70 KB | 1s |
Now we can directly compare two MS implementations. It is clear that the VB.NET compiler uses the same underlying structure but it has much higher offset compared to the highly inefficient C# expression compiler. I have filed a connect bug here with a harsher wording about recent advances in memory consumption. The funniest thing is that one MS employee did give an Azure AppFabric demo around early 2011 which was so slow that he needed to investigate with xperf. He was after startup time and the call stacks with regards to VB.NET expression compilation were remarkably similar. In fact I only found this post by googling for parts of my call stacks.
… “C# expressions will be coming soon to WF, and that will have different performance characteristics than VB” …
What did he know Jan 2011 what I did no know until today? ;-). He knew that C# expression will come but that they will not be automatically have better footprint. It is about time to fix that. In its current state C# expressions are not usable for bigger workflows. That also explains the headline for today. You can cheat startup time by prestarting workflows so that the demo looks nice and snappy but it does hurt scalability a lot since you do need much more memory than necessary.
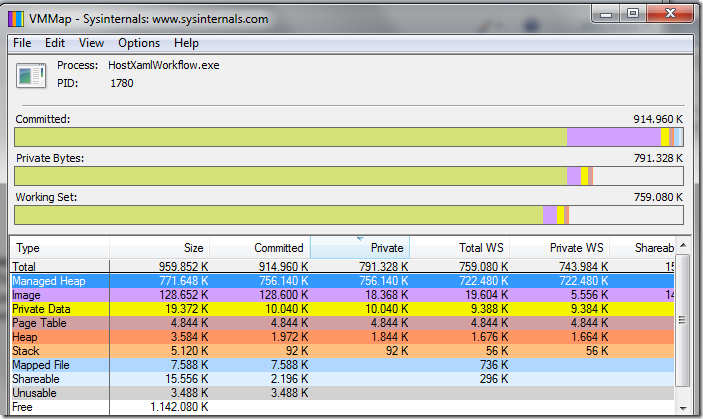
I did find the stacks by enabling virtual allocation tracking within XPerf which is still the best tool out there. But first you need to look at your process to check where the memory is hiding:
For the C# Expression compiler you do not need xperf. You can directly dump the managed heap and check with a profiler of your choice. But if the allocations are happening on the Private Data ( VirtualAlloc ) you can find it with xperf. There is a nice video on channel 9 explaining VirtualAlloc tracking it in greater detail.
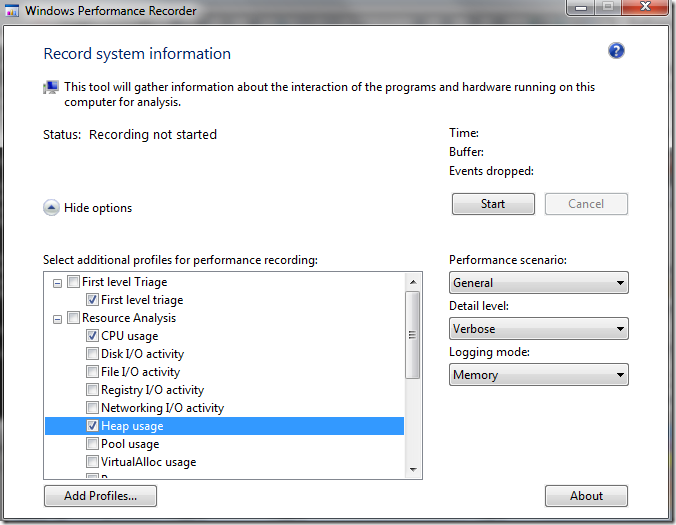
If your data allocations are on the Heap it does mean that the C/C++ runtime did create a heap for you where all malloc, new calls do allocate from it. You can enable heap tracing with xperf and full call stack support as well which is doable via xperf like it is shown also on channel 9. Or you can use WPRUI directly:
To make “Heap Usage” it work you need to set for your executable the tracing flags (before you start it). For example devenv.exe
HKEY_LOCAL_MACHINE\SOFTWARE\Microsoft\Windows NT\CurrentVersion\Image File Execution Options\devenv.exe
DWORD TracingFlags 1
Do not forget to disable it after you did complete profiling the process or it will impact the startup time quite a lot. You can with xperf attach directly to a running process and collect heap allocation information from a gone wild process. Very handy if you need to find out what a process was doing which has arrived in a funny state.
“VirtualAlloc usage” does work without explicitly enabling stuff for a specific process and is always on machine wide. I had issues on my Windows 7 machines with the call stack collection and the latest Windows 8.1 Performance Toolkit. I was told that WPA from Windows 8.0 should work fine but I do not want to downgrade.
© Geeks with Blogs or respective owner

