how to handle an asymptote/discontinuity with Matplotlib
Posted
by Geddes
on Stack Overflow
See other posts from Stack Overflow
or by Geddes
Published on 2010-03-29T18:27:09Z
Indexed on
2010/03/29
22:33 UTC
Read the original article
Hit count: 563
Hello all. Firstly - thanks again for all your help. Sorry not to have accepted the responses to my previous questions as I did not know how the system worked (thanks to Mark for pointing that out!). I have since been back and gratefully acknowledged the kind help I have received.
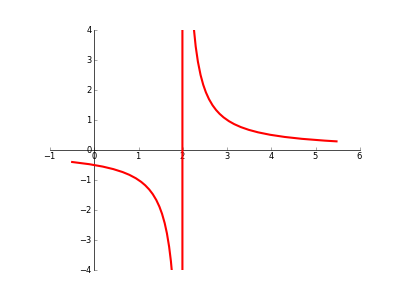
My question: when plotting a graph with a discontinuity/asymptote/singularity/whatever, is there any automatic way to prevent Matplotlib from 'joining the dots' across the 'break'? (please see code/image below). I read that Sage has a [detect_poles] facility that looked good, but I really want it to work with Matplotlib.
Thanks and best wishes, Geddes
import matplotlib.pyplot as plt
import numpy as np
from sympy import sympify, lambdify
from sympy.abc import x

fig = plt.figure(1)
ax = fig.add_subplot(111)

# set up axis
ax.spines['left'].set_position('zero')
ax.spines['right'].set_color('none')
ax.spines['bottom'].set_position('zero')
ax.spines['top'].set_color('none')
ax.xaxis.set_ticks_position('bottom')
ax.yaxis.set_ticks_position('left')

# setup x and y ranges and precision
xx = np.arange(-0.5,5.5,0.01)

# draw my curve
myfunction=sympify(1/(x-2))
mylambdifiedfunction=lambdify(x,myfunction,'numpy')
ax.plot(xx, mylambdifiedfunction(xx),zorder=100,linewidth=3,color='red')

#set bounds
ax.set_xbound(-1,6)
ax.set_ybound(-4,4)

plt.show()
© Stack Overflow or respective owner