GPU Debugging with VS 11

Posted by Daniel Moth on Daniel Moth See other posts from Daniel Moth or by Daniel Moth
Published on Wed, 21 Sep 2011 02:21:37 GMT Indexed on 2011/11/11 18:18 UTC
Read the original article Hit count: 834

With VS 11 Developer Preview we have invested tremendously in parallel debugging for both CPU (managed and native) and GPU debugging. I'll be doing a whole bunch of blog posts on those topics, and in this post I just wanted to get people started with GPU debugging, i.e. with debugging C++ AMP code.

First I invite you to watch 6 minutes of a glimpse of the C++ AMP debugging experience though this video (ffw to minute 51:54, up until minute 59:16). Don't read the rest of this post, just go watch that video, ideally download the High Quality WMV.

Summary

GPU debugging essentially means debugging the lambda that you pass to the parallel_for_each call (plus any functions you call from the lambda, of course). CPU debugging means debugging all the code above and below the parallel_for_each call, i.e. all the code except the restrict(direct3d) lambda and the functions that it calls. With VS 11 you have to choose what debugger you want to use for a particular debugging session, CPU or GPU. So you can place breakpoints all over your code, then choose what debugger you want (CPU or GPU), and you'll only be able to hit breakpoints for the code type that the debugger engine understands – the remaining breakpoints will appear as unbound. If you want to hit the unbound breakpoints, you'd have to stop debugging, and start again with the other debugger. Sorry. We suck. We know. But once you are past that limitation, I think you'll find the experience truly rewarding – seriously!

Switching debugger engines

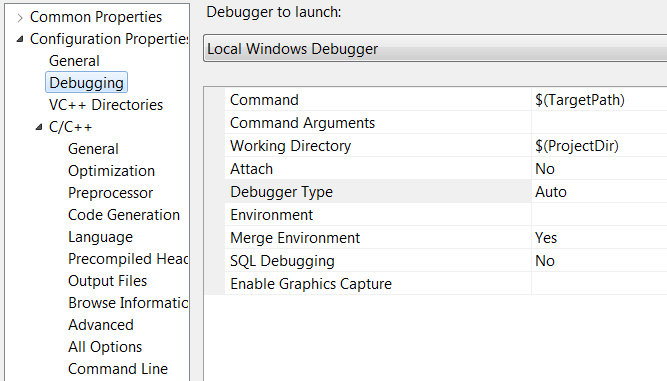
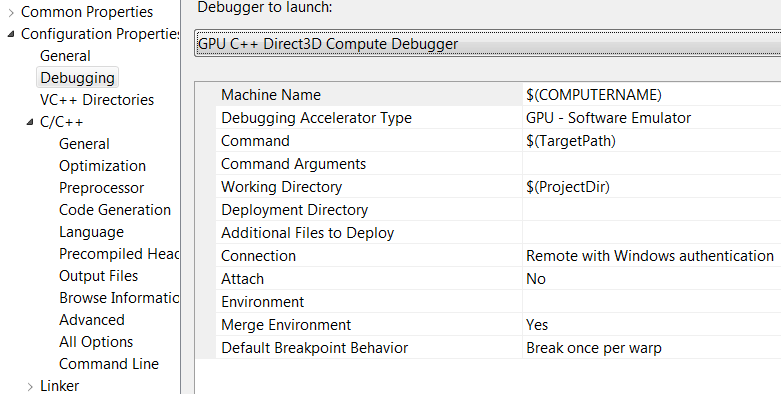
With the Developer Preview bits, one way to switch the debugger engine is through the project properties – see the screenshots that follow.

This one is showing the CPU option selected, which is basically the default that you are all familiar with:
image

This screenshot is showing the GPU option selected, by changing the debugger launcher (notice that this applies for both the local and remote case):
image

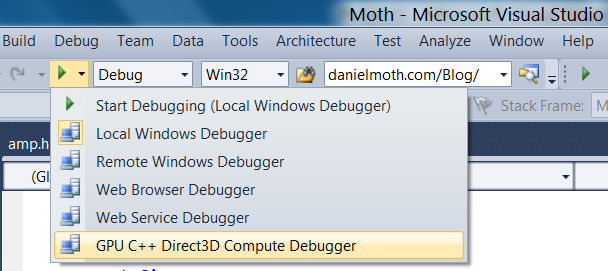
You actually do not have to open the project properties just for switching the debugger engine, you can switch the selection from the toolbar in VS 11 Developer Preview too – see following screenshot (the effect is the same as if you opened the project properties and switched there)
image

Breakpoint behavior

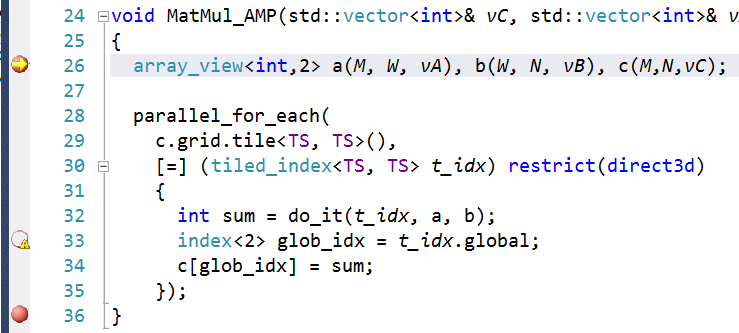
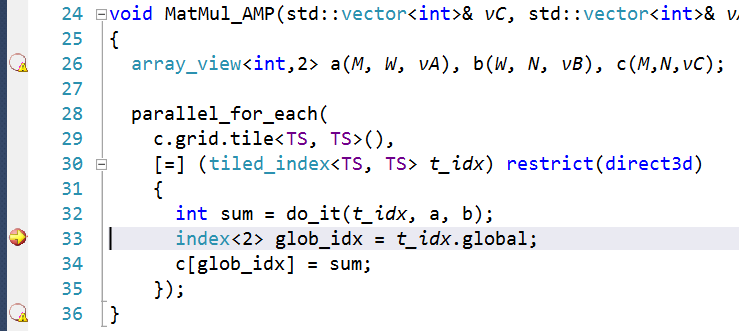
Here are two screenshots, one showing a debugging session for CPU and the other a debugging session for GPU (notice the unbound breakpoints in each case)
image

…and here is the GPU case (where we cannot bind the CPU breakpoints but can the GPU breakpoint, which is actually hit)
image

Give C++ AMP debugging a try

So to debug your C++ AMP code, pull down the drop down under the 'play' button to select the 'GPU C++ Direct3D Compute Debugger' menu option, then hit F5 (or the 'play' button itself). Then you can explore debugging by exploring the menus under the Debug and under the Debug->Windows menus. One way to do that exploration is through the C++ AMP debugging walkthrough on MSDN.

Another way to explore the C++ AMP debugging experience, you can use the moth.cpp code file, which is what I used in my BUILD session debugger demo. Note that for my demo I was using the latest internal VS11 bits, so your experience with the Developer Preview bits won't be identical to what you saw me demonstrate, but it shouldn't be far off.

Stay tuned for a lot more content on the parallel debugger in VS 11, both CPU and GPU, both managed and native.


Comments about this post by Daniel Moth welcome at the original blog.

© Daniel Moth or respective owner

Related posts about GPGPU

  • GPGPU

    as seen on Daniel Moth - Search for 'Daniel Moth'
    WhatGPU obviously stands for Graphics Processing Unit (the silicon powering the display you are using to read this blog post). The extra GP in front of that stands for General Purpose computing.So, altogether GPGPU refers to computing we can perform on GPU for purposes beyond just drawing on the screen… >>> More

  • gpgpu vs. physX for physics simulation

    as seen on Game Development - Search for 'Game Development'
    Hello First theoretical question. What is better (faster)? Develop your own gpgpu techniques for physics simulation (cloth, fluids, colisions...) or to use PhysX? (If i say develop i mean implement existing algorithms like navier-strokes...) I don't care about what will take more time to develop… >>> More

  • Financial applications on GPGPU

    as seen on Stack Overflow - Search for 'Stack Overflow'
    I want to know what sort of financial applications can be implemented using a GPGPU. I'm aware of Option pricing/ Stock price estimation using Monte Carlo simulation on GPGPU using CUDA. Can someone enumerate the various possibilities of utilizing GPGPU for any application in Finance domain, >>> More

  • Best approach for GPGPU/CUDA/OpenCL in Java?

    as seen on Stack Overflow - Search for 'Stack Overflow'
    General-purpose computing on graphics processing units (GPGPU) is a very attractive concept to harness the power of the GPU for any kind of computing. I'd love to use GPGPU for image processing, particles, and fast geometric operations. Right now, it seems the two contenders in this space are CUDA… >>> More

  • GPGPU programming with OpenGL ES 2.0

    as seen on Stack Overflow - Search for 'Stack Overflow'
    I am trying to do some image processing on the GPU, e.g. median, blur, brightness, etc. The general idea is to do something like this framework from GPU Gems 1. I am able to write the GLSL fragment shader for processing the pixels as I've been trying out different things in an effect designer app… >>> More

Related posts about ParallelComputing

  • Screencasts introducing C++ AMP

    as seen on Daniel Moth - Search for 'Daniel Moth'
    It has been almost 2.5 years since I last recorded a screencast, and I had forgotten how time consuming they are to plan/record/edit/produce/publish, but at the same time so much fun to see the end result! So below are links to 4 screencasts to teach you C++ AMP basics from scratch (even if you class… >>> More

  • C++ AMP Video Overview

    as seen on Daniel Moth - Search for 'Daniel Moth'
    I hope to be recording some C++ AMP screencasts for channel9 soon (you'll find them through my regular screencasts link on the left), and in all of them I will assume you have watched this short interview overview of C++ AMP.   Note: I think there were some technical problems with streaming… >>> More

  • GPGPU

    as seen on Daniel Moth - Search for 'Daniel Moth'
    WhatGPU obviously stands for Graphics Processing Unit (the silicon powering the display you are using to read this blog post). The extra GP in front of that stands for General Purpose computing.So, altogether GPGPU refers to computing we can perform on GPU for purposes beyond just drawing on the screen… >>> More

  • GPU Debugging with VS 11

    as seen on Daniel Moth - Search for 'Daniel Moth'
    With VS 11 Developer Preview we have invested tremendously in parallel debugging for both CPU (managed and native) and GPU debugging. I'll be doing a whole bunch of blog posts on those topics, and in this post I just wanted to get people started with GPU debugging, i.e. with debugging C++ AMP code… >>> More

  • Microsoft Windows HPC Server R2 Beta2

    as seen on Daniel Moth - Search for 'Daniel Moth'
    Internally and unofficially we refer to this as "HPC Server v3" and its Beta2 became available last week. Read the full story on this blog post from Ryan and this one from Don. There has been a lot of excitement on the web for this release with coverage from last Wednesday here, here, here… >>> More