Live Debugging
Posted
by Daniel Moth
on Daniel Moth
See other posts from Daniel Moth
or by Daniel Moth
Published on Wed, 14 Mar 2012 03:33:08 GMT
Indexed on
2012/03/18
18:16 UTC
Read the original article
Hit count: 620
random
|SoftwareProcess
Based on my classification of diagnostics, you should know what live debugging is NOT about - at least according to me :-) and in this post I'll share how I think of live debugging.
These are the (outer) steps to live debugging
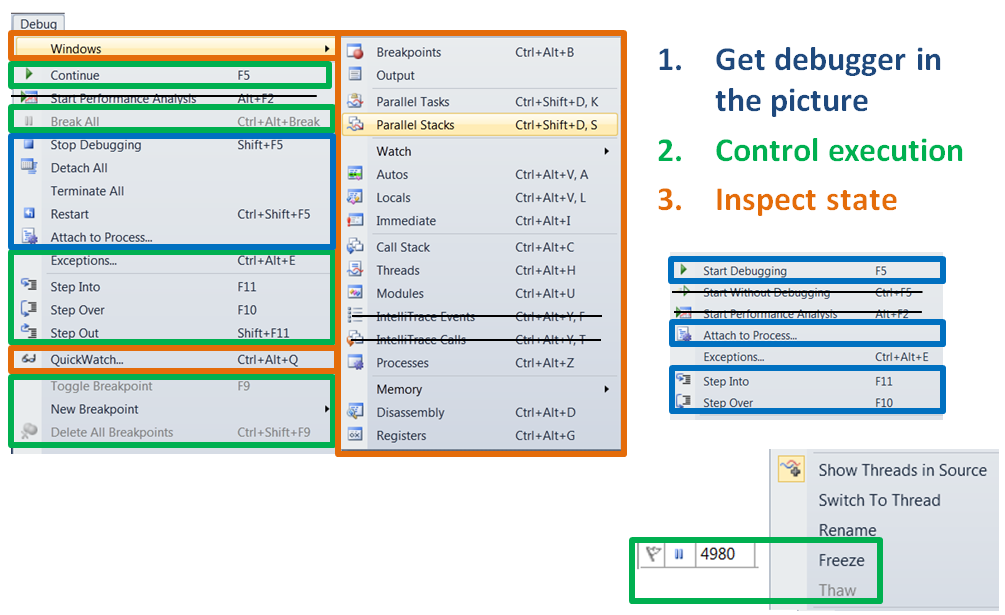
- Get the debugger in the picture.
- Control program execution.
- Inspect state.
- Iterate between 2 and 3 as necessary.
- Stop debugging (and potentially start new iteration going back to step 1).
Step 1 has two options: start with the debugger attached, or execute your binary separately and attach the debugger later. You might say there is a 3rd option, where the app notifies you that there is an issue, referred to as JIT debugging. However, that is just a variation of the attach because that is when you start the debugging session: when you attach. I'll be covering in future posts how this step works in Visual Studio.
Step 2 is about pausing (or breaking) your app so that it makes no progress and remains "frozen". A sub-variation is to pause only parts of its execution, or in other words to freeze individual threads. I'll be covering in future posts the various ways you can perform this step in Visual Studio.
Step 3, is about seeing what the state of your program is when you have paused it. Typically it involves comparing the state you are finding, with a mental picture of what you thought the state would be. Or simply checking invariants about the intended state of the app, with the actual state of the app. I'll be covering in future posts the various ways you can perform this step in Visual Studio.
Step 4 is necessary if you need to inspect more state - rinse and repeat. Self-explanatory, and will be covered as part of steps 2 & 3.
Step 5 is the most straightforward, with 3 options: Detach the debugger; terminate your binary though the normal way that it terminates (e.g. close the main window); and, terminate the debugging session through your debugger with a result that it terminates the execution of your program too. In a future post I'll cover the ways you can detach or terminate the debugger in Visual Studio.
I found an old picture I used to use to map the steps above on Visual Studio 2010. It is basically the Debug menu with colored rectangles around each menu mapping the menu to one of the first 3 steps (step 5 was merged with step 1 for that slide). Here it is in case it helps:

Stay tuned for more...
Comments about this post by Daniel Moth welcome at the original blog.
© Daniel Moth or respective owner