How to Use Sparklines in Excel 2010
Posted
by DigitalGeekery
on How to geek
See other posts from How to geek
or by DigitalGeekery
Published on Thu, 06 May 2010 18:00:00 +0000
Indexed on
2010/05/06
18:18 UTC
Read the original article
Hit count: 559
One of the cool features of Excel 2010 is the addition of Sparklines. A Sparkline is basically a little chart displayed in a cell representing your selected data set that allows you to quickly and easily spot trends at a glance.
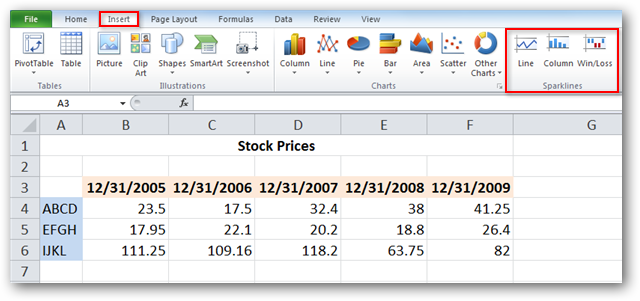
Inserting Sparklines on your Spreadsheet
You will find the Sparklines group located on the Insert tab.
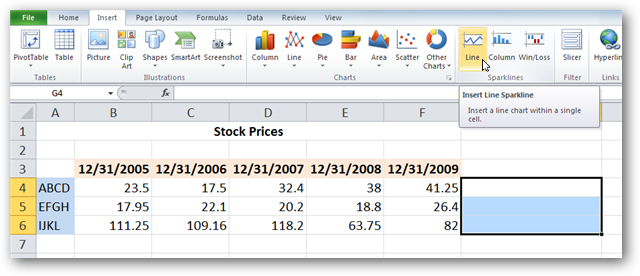
Select the cell or cells where you wish to display your Sparklines.

Select the type of Sparkline you’d like to add to your spreadsheet. You’ll notice there are three types of Sparklines, Line, Column, and Win/Loss. We’ll select Line for our example.
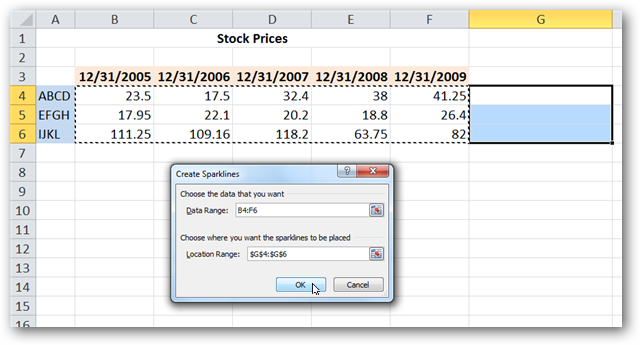
A Create Sparklines pops up and will prompt you to enter a Data Range you are using to create the Sparklines. You’ll notice that the location range (the range where the Sparklines will appear) is already filled in.
You can type in the data range manually, or click and drag with your mouse across to select the data range. This will auto-fill the data range for you. Click OK when you are finished.
You will see your Sparklines appear in the desired cells.

Customizing Sparklines
Select the one of more of the Sparklines to reveal the Design tab. You can display certain value points like high and low points, negative points, and first and last points by selecting the corresponding options from the Show group. You can also mark all value points by selecting Markers.

Select your desired Sparklines and click one of the included styles from the Style group on the Design tab.

Click the down arrow on the lower right corner of the box to display additional pre-defined styles…

or select Sparkline Color or Marker Color options to fully customize your Sparklines.

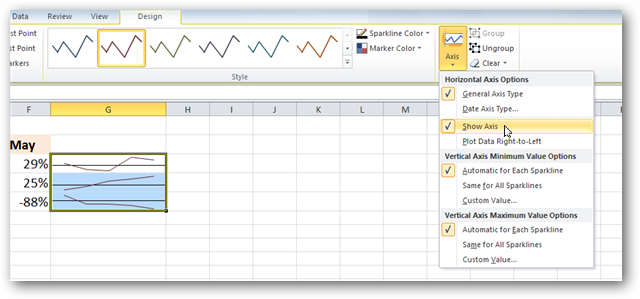
The Axis options allow additional options such as Date Axis Type, Plotting Data Left to Right, and displaying an axis point to represent the zero line in your data with Show Axis.
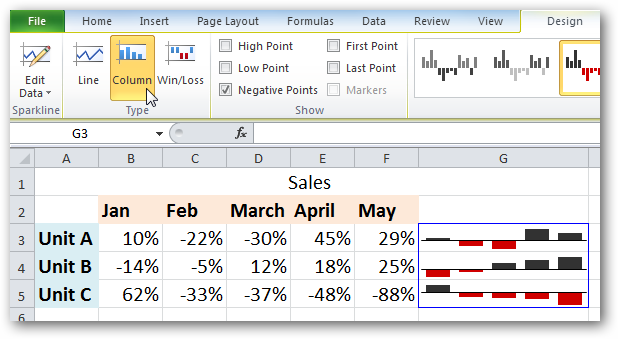
Column Sparklines
Column Sparklines display your data in individual columns as opposed to the Line view we’ve been using for our examples.

Win/Loss Sparklines
Win/Loss shows a basic positive or negative representation of your data set.

You can easily switch between different Sparkline types by simply selecting the current cells (individually or the entire group), and then clicking the desired type on the Design tab.
For those that may be more visually oriented, Sparklines can be a wonderful addition to any spreadsheet.
Are you just getting started with Office 2010? Check out some of our other great Excel posts such as how to copy worksheets, print only selected areas of a spreadsheet, and how to share data with Excel in Office 2010.

| Similar Articles | Productive Geek Tips |
| Latest Software Reviews | Tinyhacker Random Tips |
© How to geek or respective owner