Which JavaScript or ASP.NET Charting Component/Tool/Library Will Work For This?
Posted
by Jason Bunting
on Stack Overflow
See other posts from Stack Overflow
or by Jason Bunting
Published on 2010-06-09T21:31:53Z
Indexed on
2010/06/09
21:42 UTC
Read the original article
Hit count: 378
[Update]: Forgot to include ComponentArt...
Hi,
An interaction designer employed by the client I am currently working for produced some mock-ups, and now it is my job to determine the best way of implementing the charts included therein.
After looking at the options I am aware of and was able to find doing some simple Google searches, I have narrowed it down to using either ComponentArt, Dundas Charts or Infragistics, simply because from what I can see of their demos, they have certain features I believe I will need to get things done.
Here are the pictures from the mock-ups - ideally I need one piece of software that will cover all of these:
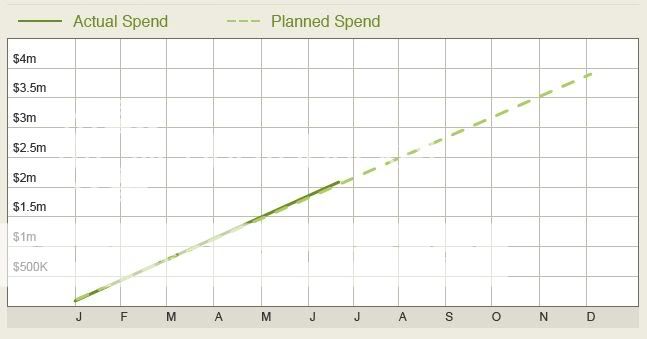
This chart seems to be simple enough.
 Notice the arbitrary spacing between the years - not yet sure if this will be a sticking-point for the client or not.
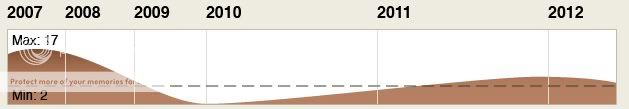
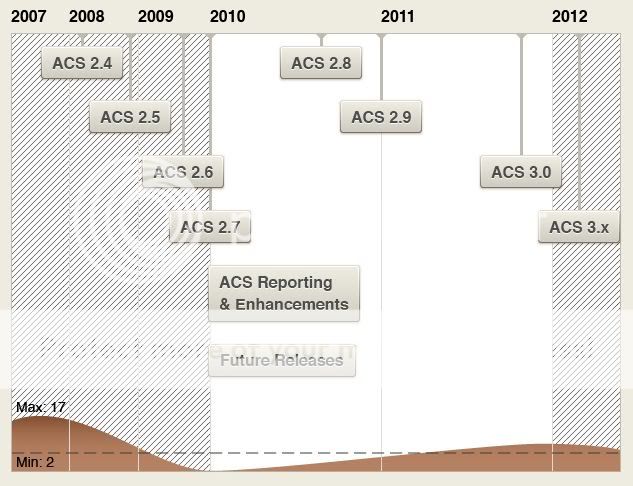 I don't know that I have ever seen a chart like this one - it combines the previous chart with some additional data.
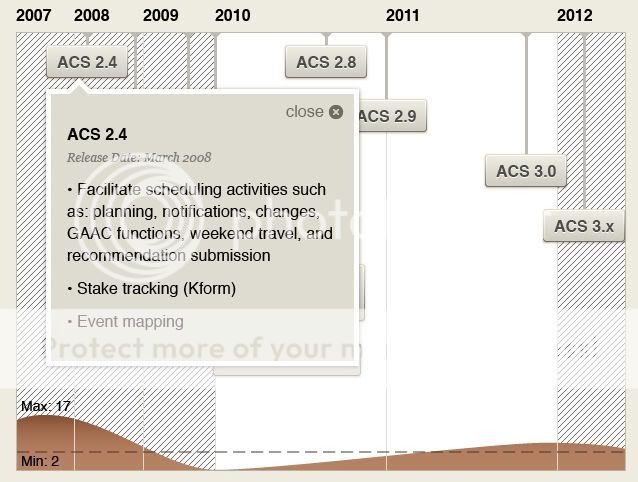 Here is the same chart, only this time illustrating what happens when a user mouses-over or clicks on an annotation within the chart. They want the nice styling within the pop-up, so the pop-up needs to be something like an iframe or similar.
Any ideas or recommendations would be appreciated, I haven't used charting controls in years, so I am at a bit of a loss and the client wants an estimate soon.
Thank you!
© Stack Overflow or respective owner